Keeping data on student programs can be a hassle sometimes can't it? Not only that, but trying to make sense of it all by analyzing it can take a lot of time as well. And I know that as a teacher, it's difficult to find time to do all of that. Well, here's a solution that might work for you...
This is a data program made for excel that does three things for you:
- First, it helps you get rid of all of those paper data sheets lying around and keeps all of your student data in one place.
- Second, it automatically produces a cumulative graph of your student's progress toward the goal for you. And by doing so helps you to see at a glance how well the student is performing overall.
- Third, it provides you with an individual analysis of the student's performance on each objective so that you can easily identify problem areas.
With this program, you will want to use "probe data" rather than continuous data with this program. And that just basically means that you will only record data at the beginning of a teaching session and provide no prompts. After that, you can teach like you normally do and don't have to record any more data for that lesson.
Also, this program also works for analyzing data for task analyses if you use backward chaining. See this page to learn more!
Let's take a look below to see how this program works...
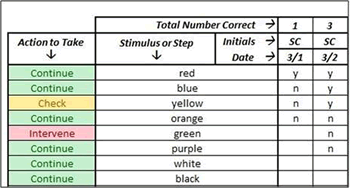
This first image is the objective analysis. It tells you to either:
- "Continue" - The student is performing well with this objective and has no problems. No intervention is necessary
- "Check" - Issues might be starting with this objective. If you have time to look at this item, that would be good. But it isn't a serious problem yet.
- "Intervene" - The student is having significant problems with this objective, and this requires observation and intervention because the typical teaching methods aren't working for this student.
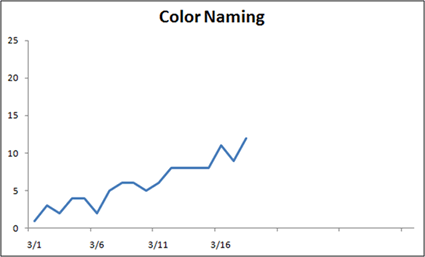
This next image shows the graph that is made. You'll notice that it is "cumulative", which means that it shows the student's overall performance rather than just their progress on a single objective. This is because in truth, we don't really want to see how well the student knows "red", we want to see how far along he is to naming the whole crayon box, right?